E-commerce
High ROAS but No Profit? Five Ways the Dashboard Lies to You
A 6x ROAS account can still lose money. Attribution over-crediting, margin blindness, retargeting inflation, and the blended-average trap — and the numbers to track instead.

PPC & Creative Strategist
A store owner once showed me an ad account averaging 5.8x ROAS — and a P&L that had lost money for three straight months.
Neither number was fake. The dashboard was answering a different question than the one that matters. ROAS tells you what the platform claims it caused per peso of ad spend. Profit depends on what it really caused, what the revenue cost you to deliver, and what would have happened anyway. The gap between those two questions is where businesses quietly bleed.
Here are the five lies, in the order I usually find them.
TL;DR
Lie 1: The attribution lie
Platform ROAS counts a conversion whenever the platform touched a buyer inside the attribution window. Someone sees your Meta ad, ignores it, googles your brand two days later, and buys: Meta claims the sale. Your loyal repeat customer clicks a retargeting ad on the way to a purchase they'd already decided on: claimed again.
The platform isn't lying maliciously — it's grading its own homework with the answer key it prefers.
What to do: compare platform-reported revenue against your store's actual orders over 30–90 days. Even simpler diagnostic: if all your Meta-attributed revenue disappeared tomorrow, would total revenue really drop that much? Businesses that run genuine holdout tests are usually surprised. For the deeper mechanics, see ecommerce attribution models.
Lie 2: The margin lie
ROAS is a revenue metric, and you don't deposit revenue.
Same dashboard number; opposite businesses. This is why any target ROAS not derived from your own margins is a random number.
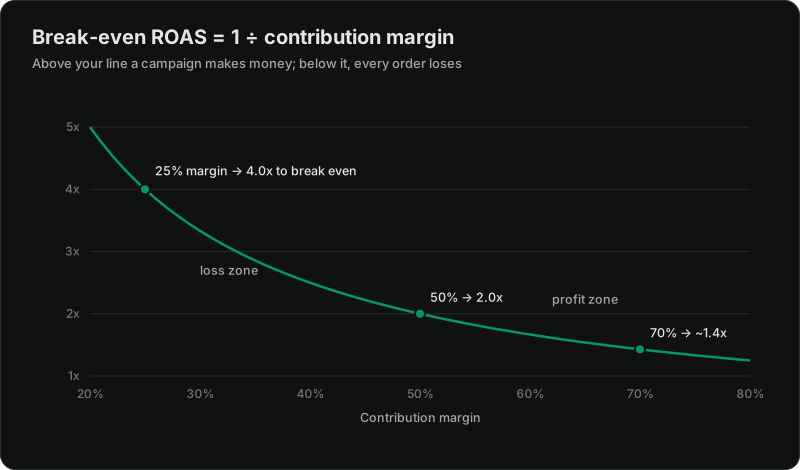
Free shipping thresholds, COD failure rates, and payment fees all move break-even too — in the Philippines, COD return rates alone can quietly turn a profitable campaign into a loss-maker.
What to do: compute your break-even ROAS once (1 ÷ contribution margin ratio) and pin it above every reporting conversation. I walk through the full derivation in how much to spend on ads.
Lie 3: The retargeting lie
Split any account's ROAS by audience temperature and a pattern appears:
The blend reads as a healthy 4x. But retargeting and brand mostly harvest demand that existing customers and your other marketing already created — high ROAS partly because the sale was already coming. Meanwhile the actual growth engine, cold acquisition, may be running below break-even and hiding inside the average.
What to do: always read ROAS split by cold vs warm vs brand. Judge growth by what cold traffic costs; judge retargeting by frequency and incrementality, not by its flattering ROAS. Related: retargeting strategies for ecommerce.
Lie 4: The blended-average lie
An account spending ₱300K/month at 4x blended might decompose into: the first ₱200K earning 5x, the last ₱100K earning 2x. If your break-even is 2.5x, that last ₱100K is burning money right now — and the dashboard average will still look fine while it happens.
This is the single most common scaling mistake I see: "our ROAS is above target, increase budget." The average is above target. The margin — the performance of the next peso — may already be below it.
What to do: when you change budgets, compare the weeks after against the weeks before at each level. Scale in steps, and treat a declining marginal ROAS as the real signal even while the blend looks healthy.
Lie 5: The quality lie (lead gen edition)
For service businesses the same failure wears different clothes: cost per lead drops, the team celebrates, and revenue doesn't move — because the cheap leads don't answer the phone. Platforms optimize toward whoever completes the conversion event, and the easiest people to convert are rarely the best customers.
What to do: track cost per qualified lead and cost per closed customer, and feed quality signals back to the platform. Full playbook in getting leads but no clients.
What to steer by instead
The scoreboard that can't lie to you is short:
Platform ROAS stays useful as a directional, relative signal — comparing campaigns, spotting trend breaks. It just can't be the number that decides budgets.
If your dashboard and your bank account disagree
Related reading:

Written by
Vince Servidad
PPC & Creative Strategist
I manage Google Ads and Meta Ads for ecommerce, healthcare, SaaS, events and nonprofits, with creative strategy, Shopify development and conversion tracking.