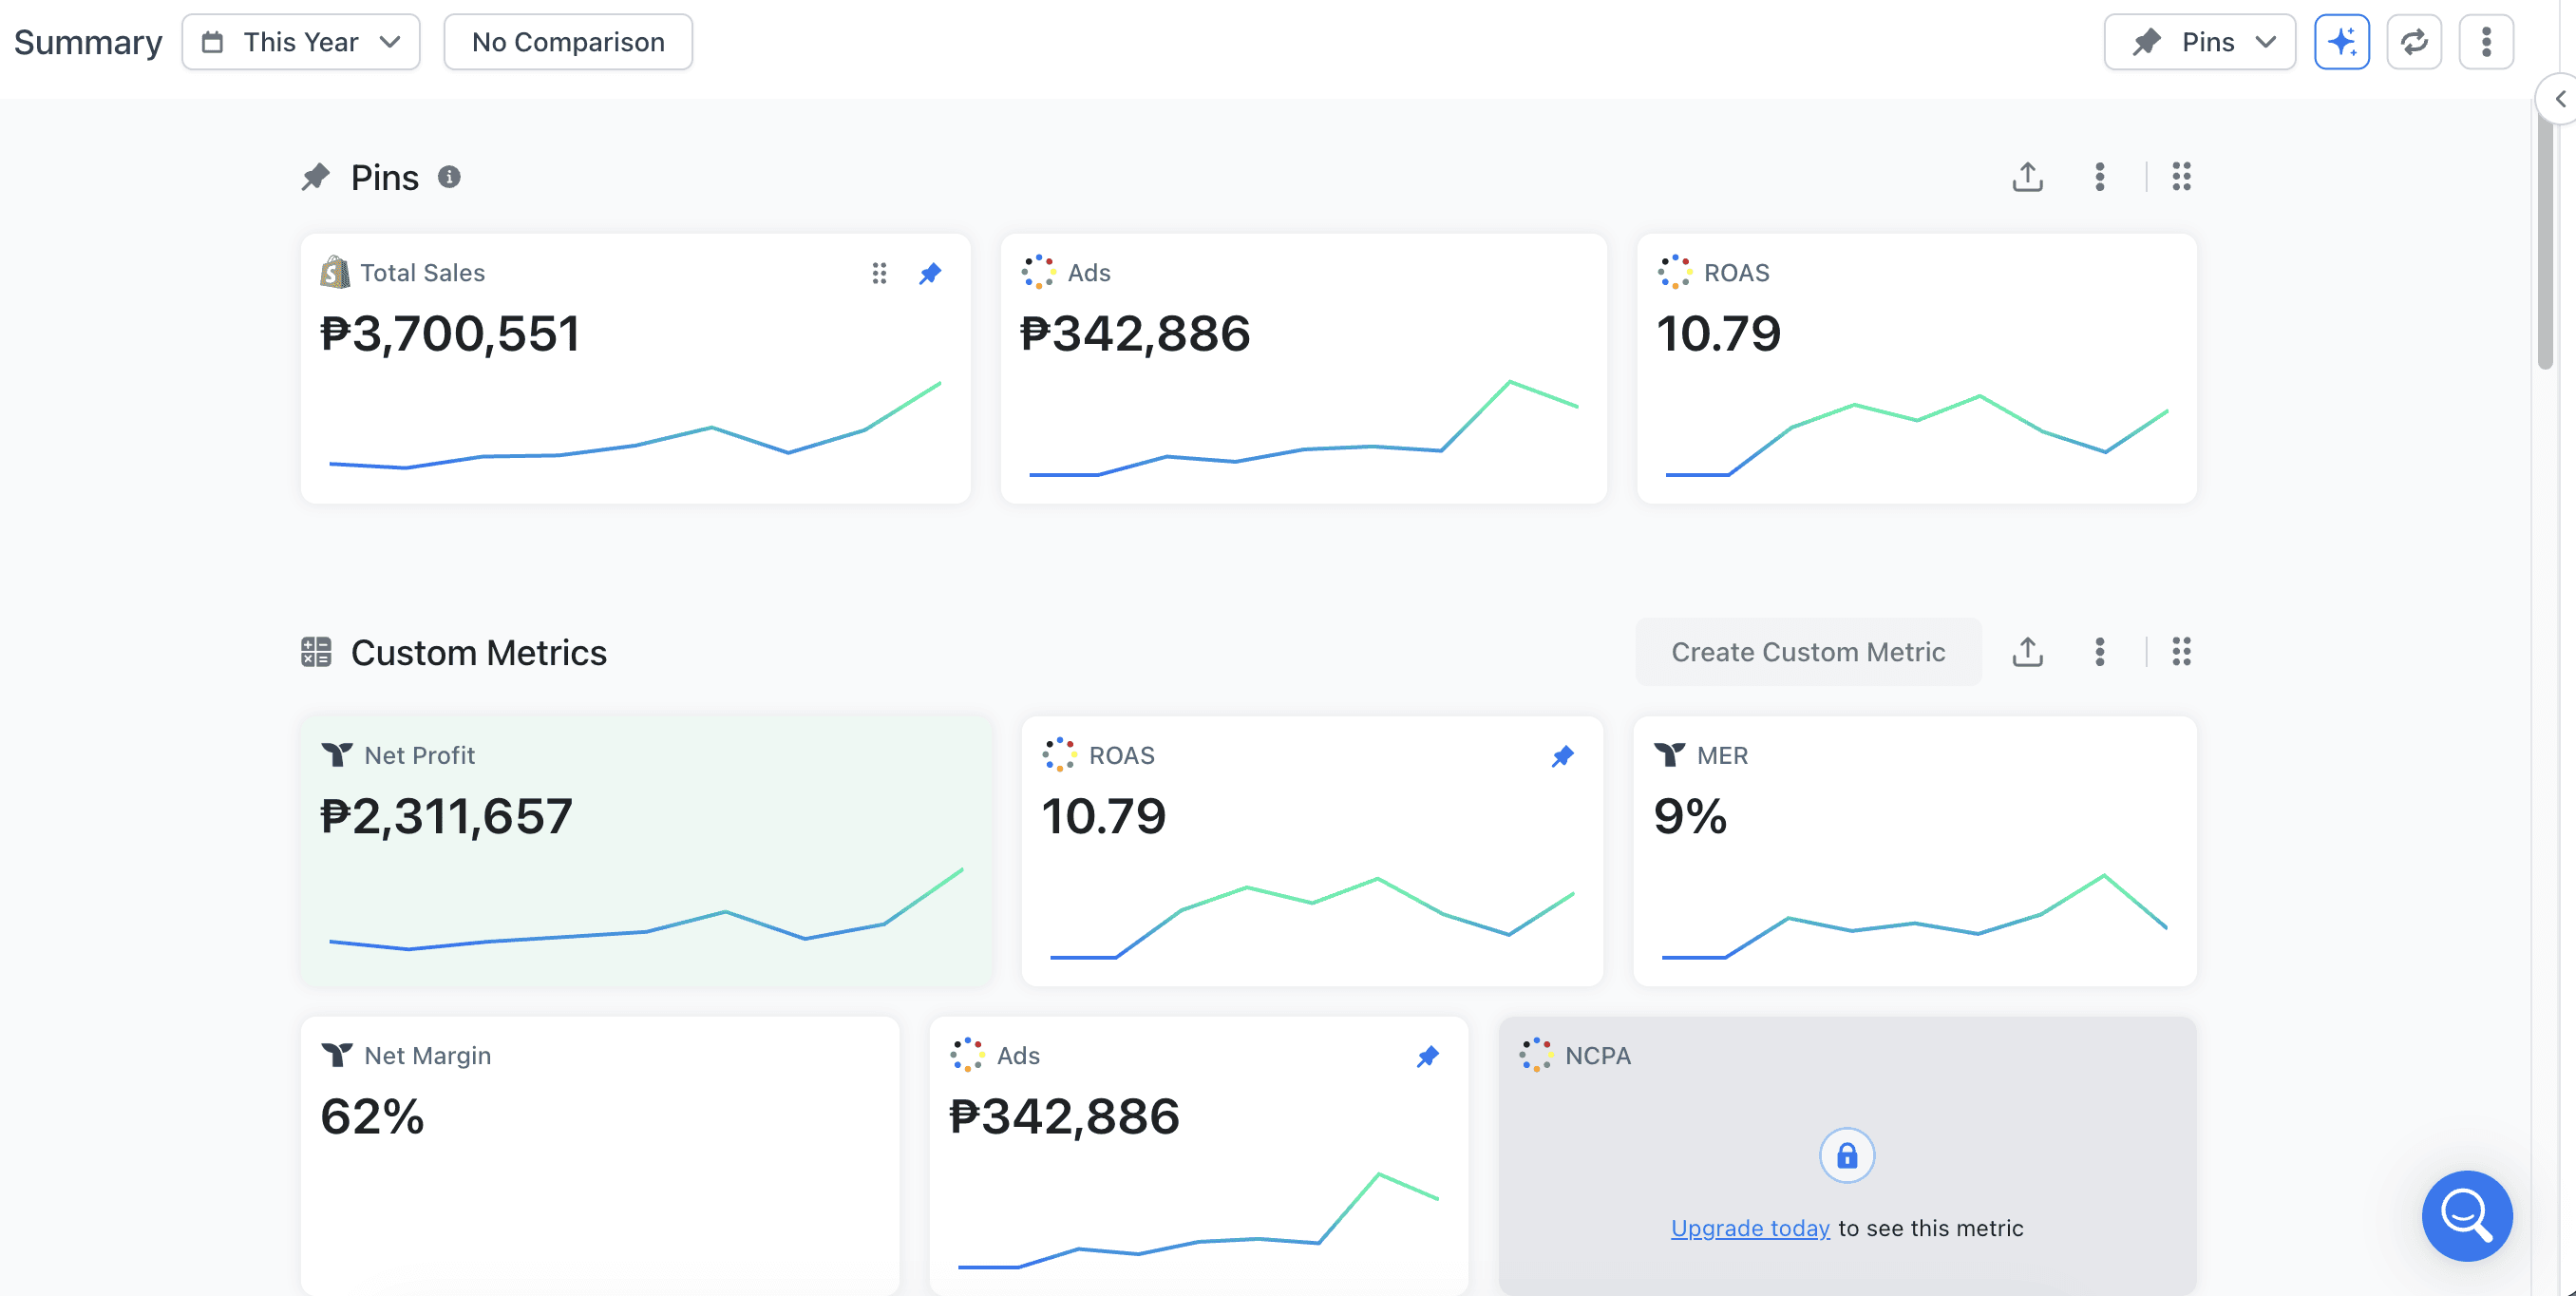
₱2.31M net profit at 10.79x blended ROAS in the annual view
The annual dashboard reports ₱3,700,551 in total sales, ₱342,886 in ad spend, 10.79x blended ROAS, ₱2,311,657 in net profit, and a 62% net margin.
Evidence boundary
What this screenshot proves
The dashboard shows the relationship between sales, ad spend, blended return, net profit, marketing efficiency, and net margin for the selected annual period.
The supplied screenshot is an annual performance view. It verifies the displayed totals but does not, by itself, prove which campaign, creative, or landing-page changes produced them.
Evidence
Screenshots behind the result
Need this level of review for your account?
Send the website, current channels, spend level, and business goal. I will explain what I would inspect first without assuming your problem or solution is the same as this case.
Discuss Your Project
Who ran this
Vince Servidad
Performance Marketer & Creative Strategist
Performance marketer and creative strategist. Highest monthly ad spend managed: $2M+. I have operated a Shopify store for 10 years and work across paid media strategy, performance creative, measurement, landing pages, and CRO.