Shopify
How to Track Your Shopify Store's Real Profit (Weekly, in One Sheet)
Shopify shows you revenue. Revenue isn't the score. A simple weekly profit sheet — revenue minus COGS, fees, ad spend, and fixed costs — that tells you whether scaling ads actually makes you money.

PPC & Creative Strategist
Shopify's dashboard shows revenue, orders, and conversion rate. None of those tell you whether you made money. Plenty of stores grow revenue every month while quietly losing money on each sale — because product cost, shipping, fees, returns, and ad spend never get subtracted in one place.
Here's a simple weekly profit sheet that does subtract them. It takes fifteen minutes to build, ten minutes a week to run, and it's the single most clarifying habit for a store owner spending on ads.
TL;DR
Why Shopify's numbers mislead you
Shopify optimizes its dashboard for revenue and orders because those always go up and feel good. But the chain from revenue to profit has five subtractions, and any one of them can turn a "great month" into a loss:
A store at 5.8x ROAS on the ad dashboard can still lose money once these land — the ad-side version of this trap is in high ROAS but no profit. The only cure is subtracting them yourself, weekly.
The weekly profit waterfall
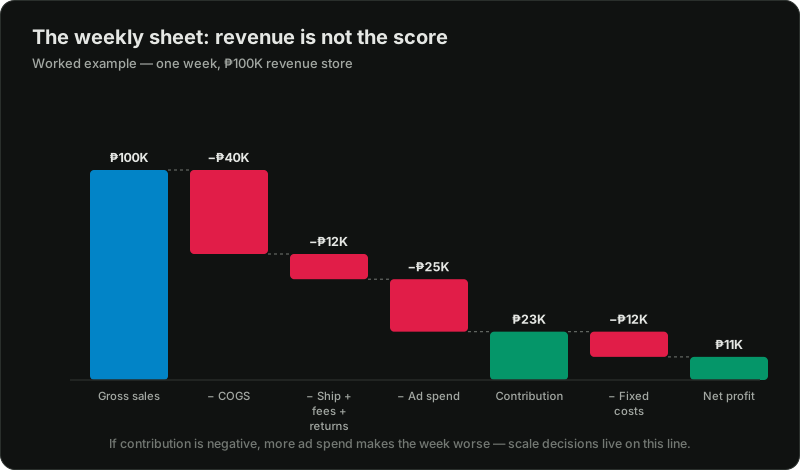
Read the sheet top to bottom — each line subtracts from the one above:
1. Gross sales — sales for the week *before* returns and discounts (Shopify Analytics → Gross sales, not "Total sales"). Start from gross so the returns line below isn't double-counted — Shopify's headline "Total sales" already has returns and discounts netted out, so subtracting them again would understate your profit.
2. − COGS — units sold × unit cost. Keep a cost per SKU; this is the biggest and most-forgotten subtraction.
3. − Shipping, fees, returns — refunded order value, plus the shipping cost you absorbed, payment processing fees, and packaging. In the Philippines, COD return/failure rates belong here and can be brutal — an unclaimed COD parcel costs you shipping both ways with zero revenue.
4. − Ad spend — everything across Meta, Google, TikTok, boosted posts, influencers.
= Contribution margin. This is the number that matters most. It's what each week contributes toward covering fixed costs and profit. If it's negative, you are losing money on volume, and spending more on ads makes it worse. No dashboard shows you this line — you have to build it.
5. − Fixed costs — weekly share of apps, subscriptions, rent, salaries, tools.
= Net profit. What actually landed in the business.
Building it in Google Sheets (15 minutes)
1. Columns: one per week (or a row per week — either works). Label rows exactly as the waterfall above.
2. Gross sales: pull the Gross sales figure from Shopify Analytics weekly (not "Total sales," which already nets out returns and discounts), or connect Shopify → Sheets with a free connector.
3. COGS: maintain a small SKU-cost table; multiply by units sold. If you sell many SKUs, an average COGS % of sales is a fine start.
4. Shipping/fees/returns: payment fees are roughly a known % (check your processor); refunded order value, shipping, and returns from your records. Estimate COD failure from history.
5. Ad spend: sum every channel. This is the number owners most often understate by forgetting boosted posts.
6. Formulas: Contribution = Gross sales − COGS − Shipping/fees/returns − Ad spend. Net = Contribution − Fixed. That's the whole model.
Round where you must — an approximately right profit number beats a precisely tracked revenue number.
Reading the sheet
The sheet turns "are we doing well?" from a vibe into a number — and turns scaling from a gamble into a decision.
Where this connects to your ads
This sheet is also the honest scoreboard your ad account should be judged against. Platform ROAS overstates its contribution (see why the platform numbers don't match); your contribution-margin line is the reality check. When the two disagree, believe the sheet. And if traffic is arriving but this sheet stays flat, the constraint may be conversion rather than ads — diagnosed in order in Shopify traffic but no sales.
Want the whole picture connected — ads, store, and margin?
Related reading:

Written by
Vince Servidad
PPC & Creative Strategist
I manage Google Ads and Meta Ads for ecommerce, healthcare, SaaS, events and nonprofits, with creative strategy, Shopify development and conversion tracking.