Performance Marketing
How to Build a Paid Ads Profit Scorecard for Google and Facebook
Replace platform screenshots with one weekly view that connects spend to qualified leads, customers, revenue, margin, and the next decision. Includes the exact columns and review routine.

PPC & Creative Strategist
Most paid-ads reports explain what happened inside an advertising platform.
A useful scorecard explains what happened to the business.
The difference matters because Meta and Google can both report strong results while sales quality, contribution margin, or cash flow deteriorates.
This guide shows how to build one weekly scorecard that connects media spend to the outcome you actually care about.
TL;DR
Step 1: Choose the commercial outcome
Your scorecard needs one primary outcome.
| Business model | Primary outcome |
|---|---|
| Ecommerce | Contribution profit |
| Lead generation | Qualified or won clients |
| Home services | Booked or completed jobs |
| SaaS | Activated or retained customers |
| Nonprofit | Confirmed donation value |
Clicks, CTR, CPC, and raw leads are diagnostic metrics. They are not the finish line.
Step 2: Define the reporting grain
Report at the level where a decision can be made.
Useful dimensions:
Do not create so many rows that every number becomes statistically meaningless.
Step 3: Build the core scorecard
Use these columns:
| Column | Calculation or source |
|---|---|
| Spend | Platform billing |
| Platform conversions | Meta or Google |
| Confirmed outcomes | Store, CRM, booking, or finance system |
| Revenue | Confirmed business revenue |
| Gross or contribution profit | Revenue minus variable costs |
| Cost per confirmed outcome | Spend ÷ confirmed outcomes |
| Revenue ROAS | Revenue ÷ spend |
| Profit after ads | Contribution profit minus spend |
| Lead or order quality rate | Confirmed outcomes ÷ platform conversions |
For lead generation, add:
Step 4: Separate reported and confirmed outcomes
Never overwrite one with the other.
Keep both:
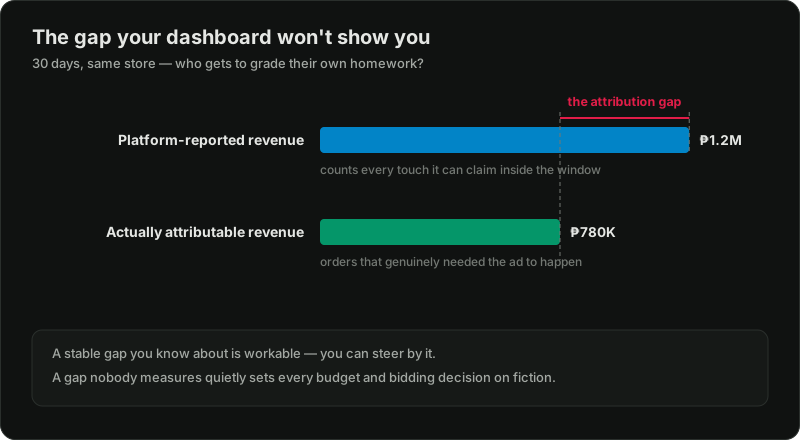
Then calculate the gap.
If Meta reports 120 purchases and the store confirms 92 relevant orders, the 28-order difference needs explanation. If Google reports 80 leads and sales confirms 24 qualified opportunities, raw CPL is not the management target.
Step 5: Add the economic inputs
For ecommerce:
For lead generation:
For recurring revenue:
Your break-even target should come from these inputs—not a benchmark article.
Step 6: Add operational guardrails
Advertising cannot be managed separately from capacity.
Include:
A campaign can be profitable and still need less budget because the business cannot fulfil additional demand well.
Step 7: Create a diagnostic layer
Only after the commercial summary, add platform diagnostics.
Google Ads diagnostics
Meta diagnostics
Diagnostics should explain the result—not compete with it.
Step 8: Add comparisons that matter
Show:
Avoid reacting to one volatile day. Use the comparison window that matches your conversion volume and sales cycle.
Step 9: Write the decision block
Every scorecard should finish with:
Stop
What spend, query, creative, or process should stop?
Fix
What tracking, page, offer, or follow-up constraint needs attention?
Scale
Where has profitability been confirmed strongly enough to add budget?
Learn
What question should the next test answer?
If the report does not change a decision, it is decoration.
Worked lead-generation example
| Metric | Meta | |
|---|---|---|
| Spend | $2,000 | $1,500 |
| Raw leads | 60 | 100 |
| Qualified leads | 30 | 20 |
| Won clients | 8 | 5 |
| Raw CPL | $33 | $15 |
| Cost per qualified lead | $67 | $75 |
| Cost per client | $250 | $300 |
Meta appears far cheaper at raw CPL. After qualification and sales, the channels are almost equal.
That changes the next question from “How do we move budget to cheap Meta leads?” to “Which channel produces higher-value clients and which qualification or follow-up step is leaking?”
Worked ecommerce example
| Metric | Campaign A | Campaign B |
|---|---|---|
| Spend | $2,000 | $2,000 |
| Revenue | $8,000 | $6,400 |
| Platform ROAS | 4.0x | 3.2x |
| Contribution margin before ads | 30% | 48% |
| Contribution profit | $2,400 | $3,072 |
| Profit after ads | $400 | $1,072 |
The lower-ROAS campaign creates more than twice the profit after ads.
This is why ROAS without margin is incomplete.
A weekly review routine
1. Refresh platform spend.
2. Refresh confirmed business results.
3. Investigate attribution and quality gaps.
4. Check capacity and cash constraints.
5. Review campaign diagnostics.
6. Write stop, fix, scale, and learn decisions.
7. Assign owners and deadlines.
Keep the meeting short. The work happens after the decision.
Common scorecard mistakes
Start with a spreadsheet
You do not need a warehouse to begin.
A reliable weekly spreadsheet with consistent definitions is better than an automated dashboard nobody trusts. Automate only after the team agrees on stages, values, and decisions.
The scorecard is the operating layer connecting campaigns to the business. It is also the fastest way to discover whether the real constraint is media, tracking, conversion, sales, or fulfilment.

Written by
Vince Servidad
PPC & Creative Strategist
I find why paid traffic is not turning into customers, then fix it. Google Ads, Meta Ads, creative strategy, landing pages, Shopify development, conversion tracking.
Apply it to your account
Need help applying it?
Share your website, goal and current setup. We can discuss whether the project is a fit and agree on the scope before work starts.
Get a project review ↗